In a recent blog post, Ronda Zelezny-Green and Alexandra Tyers claim “now scientific fact: mobile money can lift women out of poverty”. The scientific fact they cite comes from a new study [gated] published in Science by Tavneet Suri and William Jack. This study is an impact evaluation of M-PESA in Kenya using a quasi-experimental design, and it finds that increased access to M-PESA is associated with a decrease in poverty. There is a lot of excitement these days about science, technology, and innovation and the potential for these activities to contribute to economic and social development globally (see, for example here and here). Many countries are creating national strategies for science, technology, and innovation and making investments to implement those strategies. Many donors and implementers are designing innovative programs that use technology or promote science and local innovation processes with a view to accelerating development (an example here). The flurry of activity begs the question, how much of this excitement is supported by what Zelezny-Green and Tyers call scientific facts?
To help answer this question, the United States Global Development Lab at USAID (the Lab) commissioned the International Initiative for Impact Evaluation (3ie) to create and populate a map of the evidence base for science, technology, innovation, and partnerships (STIP), the latter being a related focus of the US government (and producing an acronym that is less confusing to my public health colleagues). As part of the project, 3ie also conducted scoping research to identify not just where there are evidence clusters and gaps, but also where the demand for new evidence by stakeholders is the greatest. In the recently published scoping paper Assessing the evidence base on science, technology, innovation and partnerships for accelerating development outcomes, I and my co-authors (Shayda M. Sabet, Anna C. Heard, and Scott Neilitz) analyze the data in the map together with the information from the stakeholders to recommend priorities for investment in new research on STIP. While there is good evidence out there, new research is necessary for strategies and programming to fully benefit from scientific facts.
In this post, I briefly describe the research we conducted, summarize a few of the many findings, and list some of our recommendations.
Building the evidence gap map (EGM)
We started by developing a framework. An EGM framework is just a simple matrix. The rows list the interventions and the columns list the outcomes. (See here for more information on 3ie EGMs.) We developed the framework through a consultative process with the Lab, USAID and several other stakeholders. The interventions are grouped by science, technology, innovations and partnerships. The outcomes are grouped in three ways: first, by the level of analysis; second, by the development sectors in which the outcomes are observed; and last, by whether studies address one or more cross-cutting themes.
Using this framework, we conducted a systematic search of indexes, databases, websites, and other sources to find as many relevant impact evaluations as possible. Our broad initial search returned 37,514 hits, so just like with a systematic review, we employed a very specific screening protocol to eliminate from that set all those items that did not meet our inclusion criteria. What we included are impact evaluations (meaning studies that measure net effects of an intervention using a counterfactual design) conducted in low- or middle-income countries (L&MICs) that measure one or more outcomes of an intervention in our framework. We also included systematic reviews of STIP evaluations if those reviews used methods producing a medium or high degree of confidence in the review findings. We ended up with 320 completed impact evaluations and seven systematic reviews.
We then populated those studies into the framework according to the interventions and outcomes for which each study measured an effect. Figure 1 below (which is figure 2 in the paper) shows the final map of impact evaluations. Very simply, darker cells represent intervention categories and outcomes for which there is a large number of impact evaluations reporting effects. Note that a large number of impact evaluations only means a lot of evidence, not necessarily a lot of evidence for or a lot of evidence against. As those who conduct evidence synthesis for a living know well, in-depth analysis of such a cluster of studies is needed to determine whether the effect on the whole, or on average, is positive, negative, or null. One advantage of an EGM is that it points to where there are enough individual studies that the evidence can be synthesized.
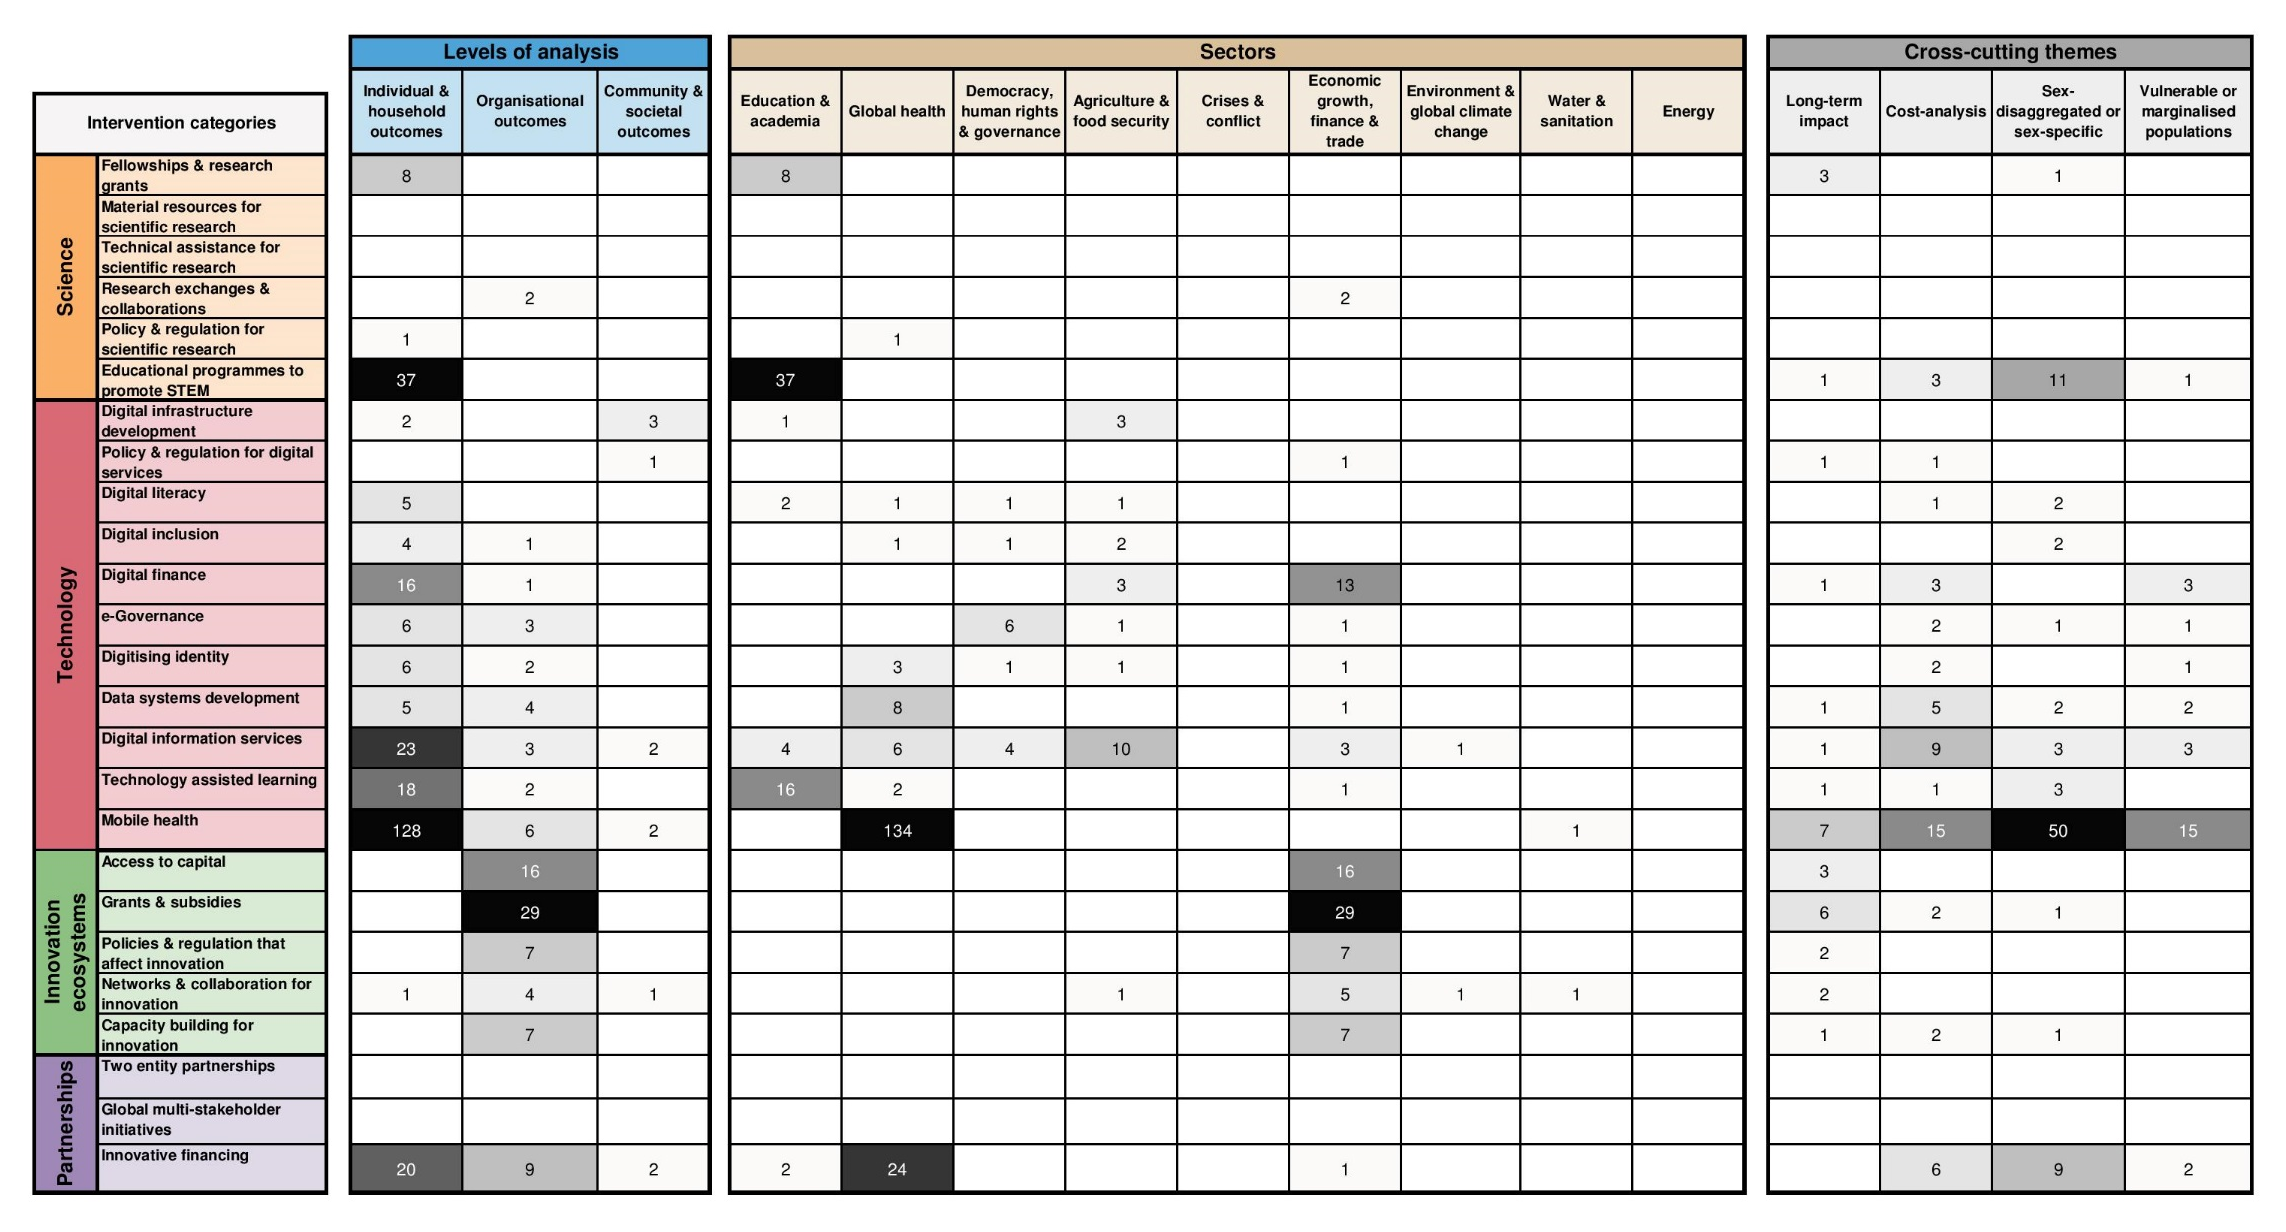
Figure 1. Evidence gap map of completed STIP impact evaluations
A few findings
Before getting into any specifics, I want to point out that 320 is a lot of studies! We were surprised to find so many, although we probably shouldn’t have been, since we know that the overall number of impact evaluations of development programs has risen dramatically over the last decade (see analysis here). That total, however, was driven in large part by the wealth of studies on mobile health interventions. The map shows that there are 134 impact evaluations of mobile health interventions that measure, not surprisingly, global health outcomes. The vast majority of these outcomes are measured at the individual or household level. Two other intervention categories that stand out in the map are STEM education and grants & subsidies to promote innovation ecosystems (the framework focuses on interventions designed to promote innovation in L&MICs, not all interventions described as “innovative”). The map shows that all 37 STEM education studies measure individual and household level outcomes in the education sector, while all 29 studies of grants & subsidies for promoting innovation measure organizational outcomes in economic growth, finance & trade.
Even for other intervention categories, we find that the outcomes measured fall most often in global health, education & academe, and economic growth, finance & trade. See figure 2 below (figure 6 in the paper). There are smaller clusters of studies with outcomes measured in agriculture & food security and democracy, human rights & governance. However, there is little to no evidence on the effect of STIP program enhancements on crisis & conflict, environment & global climate change, water & sanitation, and energy.
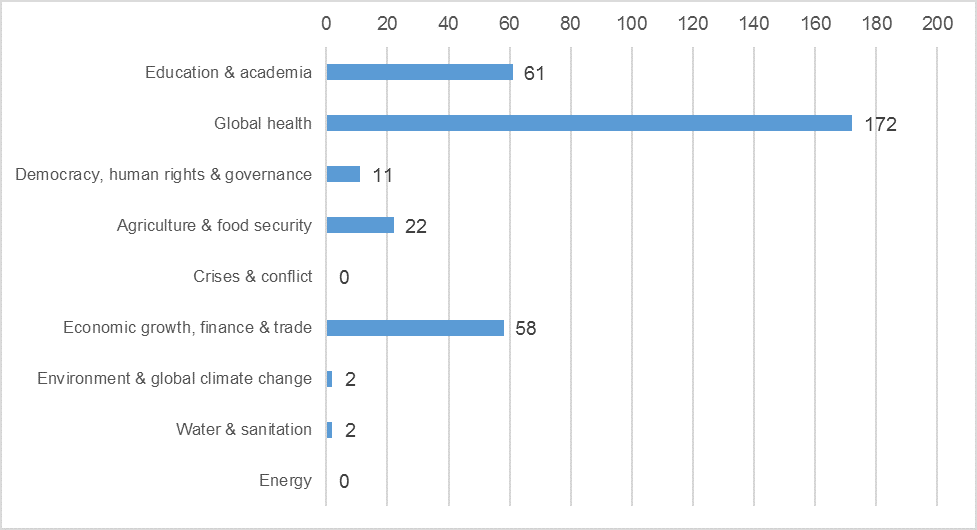
Figure 2. STIP impact evaluations by sector of outcome measurement
One thing we can explore with the EGM data is where the evidence on STIP has been generated. Figure 3 below (figure 10 in the paper) is a heat map of the impact evaluations. We see that a large number of studies comes from Kenya followed closely by India and China. A few Latin American countries also account for a large number of studies. Kenya, India, and China, along with South Africa have many of the technology studies, while the Latin American countries have more of the innovation ecosystems studies.
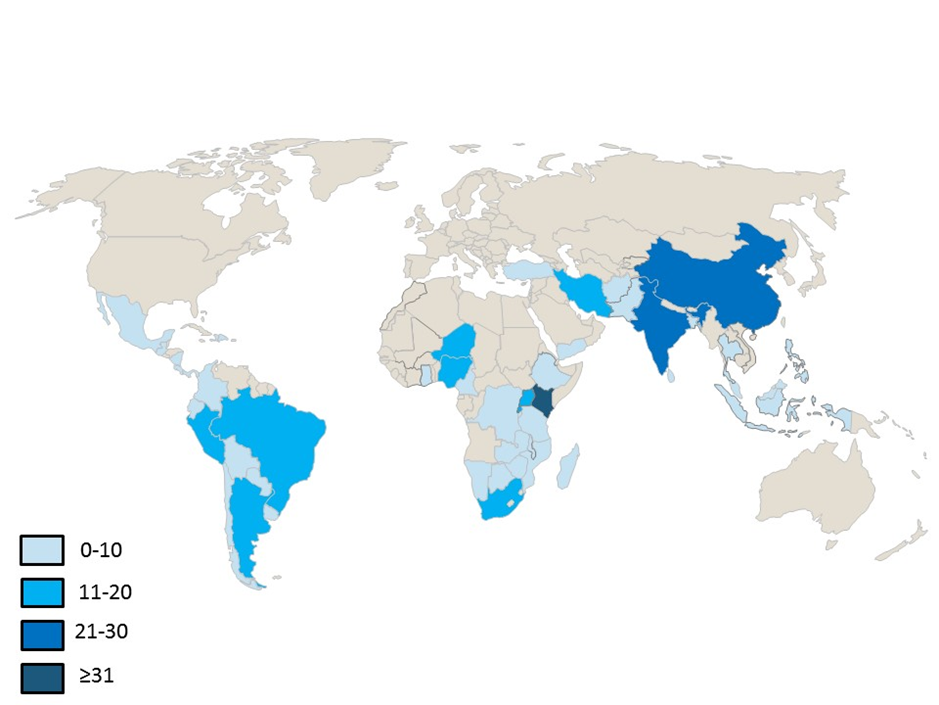
Figure 3. STIP impact evaluations by country
As noted above, we also catalogued the studies into a few cross-cutting themes to better understand what kind evidence is available for STIP. The cross-cutting themes are: long-term impact (whether the study measures an effect at a date after the initial end-line), cost analysis (whether the study includes cost information related to the measured effects), sex-disaggregated or sex-specific effects, and effects measured for vulnerable or marginalized populations. Figure 4 below (figure 7 in the paper) presents the findings. While it may seem encouraging that there are 27 impact evaluations that report effects for vulnerable or marginalized populations, all but four are for rural populations.

Figure 4. STIP impact evaluations by cross-cutting themes
What about demand for evidence?
To analyze the demand for evidence on STIP interventions, we collected data from a stakeholder survey (with 110 respondents) as well as from several consultation events and from the project’s advisory group. As this post is already long, I will not present that analysis here. But readers might be particularly interested in one of the figures from the survey data. We asked respondents about the type of evidence they use most often in their work. They were supposed to select no more than two of the five choices (including “other”). As you can see in figure 5 below (figure 12 in the paper) many more of the respondents use monitoring and evaluation evidence and non-evaluation sector research in their work than use impact evaluations. About the same number chose impact evaluations among their top two as chose anecdotal evidence.

Figure 5. What evidence do stakeholders use in their work
The recommendations
As noted above, even though we found 320 impact evaluations, we only found seven systematic reviews that meet our inclusion criteria. We consider it somewhat surprising that there are so few systematic reviews. All but one of the seven look at mobile health, but even there, the reviews contain very few of the impact evaluations included in the EGM. Cells in the map where there are clusters of studies may provide opportunities for evidence synthesis, so we took a careful look at the studies in each of the clusters to determine whether the interventions and outcomes evaluated are homogeneous enough to make synthesis promising. We found the following clusters of evidence that are promising for synthesis:
- digital finance (in particular, mobile money systems);
- digital information services for agriculture and food security;
- m-health (in particular, antiretroviral therapy adherence, lifestyle changes for chronic diseases and appointment reminders);
- innovation ecosystems programmes in Latin America;
- innovative financing (in particular, results-based financing for health);
- science, technology, engineering and mathematics educational programmes; and
- technology-assisted learning.
In the paper, we identify several intervention categories where more impact evaluations are clearly needed (not listed here). We also identify several outcomes, sectors and crosscutting themes that should be priorities for STIP-related impact evaluations based on the current evidence supply and demand:
- community- and society-level outcomes in relevant intervention categories;
- technology impact evaluations on democracy, human rights and governance outcomes;
- technology impact evaluations on agriculture and food security outcomes;
- technology impact evaluations on crises and conflict outcomes;
- science impact evaluations that report outcomes disaggregated by sex;
- digital inclusion impact evaluations that report outcomes for vulnerable or marginalised populations;
- science and innovation ecosystems impact evaluations that report long-term impacts; and
- cost analyses for technology, innovation ecosystems and innovative financing interventions.
We do not yet have enough scientific facts to inform all the STIP-related policies and programs, but there is a base, and it is growing. The EGM combined with the demand analysis allows us to focus the production of new evidence on specific questions where demand is high and supply is low. And the map helps us to see where we already do have evidence, but we need to synthesize that evidence so that it can be more useful to stakeholders.
Note: This blog first appeared on the site R&E Search For Evidence. Annette N. Brown is the former head of 3ie’s Washington Office. She was working with 3ie when the research on assessing the evidence base on STIP began.
Annette currently leads the Research and Evaluation Strategic Initiative at FHI 360. She is also the editorial leader of R&E Search for Evidence.