In August 2021, 3ie and New Light Technologies co-led a series of capacity-building workshops with 10 researchers from the African Population and Health Research Center (APHRC) on the potential to use remotely-sensed geospatial data for impact evaluation. This blog is the third in a series of four in which workshop participants reflect on the uses of remotely-sensed and geospatial data.
For a long time, Nairobi was referred to as the ‘green city in the sun’ owing to the mix of rainforest and savannah grassland on which it is built, as well as the parks and open green spaces. However, over the last couple of decades, the city of Nairobi has experienced rapid population growth and spatial extent in comparison to other major cities in the region. Subsequently, a lot of the city’s greenery has given way to concrete and tarmac as the demand for residential and commercial space has grown.
Nairobi, which in the Maa language means 'the place of cool waters', was founded in 1899 as one of the many stations dotting the Uganda Railway Line. In time, it grew into an administrative hub for the colonial government, became a city in 1950, and was later declared Kenya’s capital once the country gained its independence in 1963. Between 1950 and 1963, the city’s population jumped from 137,456 to approximately 360,798. As per the latest population census conducted in 2019, the number of people who call Nairobi home now stands at 4,397,073.
This growth has created a burgeoning demand for residential and commercial space to meet the needs of the city’s residents. These changes have put a lot of pressure on Nairobi’s green spaces, including the national park and existing forests, resulting in many environmental challenges. In turn, the population boom increased industrialization, and the reduction of green spaces has outgrown the natural environment’s ability to meet the residents’ needs for safe water, food, sanitation, and clean air.
Through satellite imagery, one can observe the gradual expansion of the city towards its neighboring counties over the last couple of decades, and the impact that has had on the natural environment. Images retrieved from Google Earth show the gradual expansion of the built environment and subsequent shrinkage of grassland and forested areas. These changes are attributable to the city’s growth as demand for housing and other amenities increases with the burgeoning population. Urban forests contribute significantly to the ecological integrity of urban areas and the quality of life of urban dwellers through air quality control, energy conservation, improving urban hydrology, and regulation of land surface temperatures. Between 2000 and 2019, the city lost approximately 6600ha of forest cover, representing a loss of about 11% in 20 years, according to scholars at the Technical University of Kenya.
The main drivers of loss are the conversion of forestlands to residential areas and farmlands, the implementation of big infrastructure projects that pass through the forests, and the extraction of timber and other resources to support urban developments. As a result of major construction work across the city, particularly that which requires the felling of large tracts of forest or tree-lined areas, Nairobi will soon lose its tag as a green city, permanently. Efforts to protect public forests and other green spaces from being grabbed by individuals in Nairobi have happened in the past through personalities such as the Late Nobel Laureate Prof. Wangari Mathai, but more vigilant efforts are still needed for the sake of the environment.
Using the normalized difference vegetation index (NDVI), information can be derived from satellite imagery to indicate tree cover and land cover change to quantify forest cover loss and changes in vegetation health. NDVI is an index calculated based on remotely-sensed imaging that quantifies the “greenness” of vegetation in a given area (by pixel), measuring the difference between the near-infrared (which vegetation strongly reflects) and red light (which vegetation absorbs). This measurement method is particularly important as the impact of climate change is felt across the globe, especially in urban areas, which continue to grow despite the decline in natural resources. This information can be used in informing decision-making on environmental and urbanization matters at the national and county levels. Examining Figures 1 and 2 visually, it is evident that the area occupied by residents has continued to grow at an exponential rate between the year 2002 and 2021.
>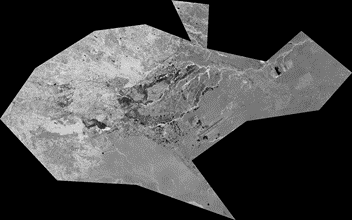
Figure 1:Black and white NDVI image for Nairobi for Year 2002; Image created by Francis Kiroro in Google Earth Engine using Landsat-7 satellite data
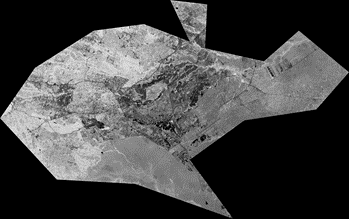
Figure 2: Black and white NDVI image for Nairobi for Year 2021; Image created by Francis Kiroro in Google Earth Engine using Sentinel-2 satellite data
Beyond the NDVI alone, the World Settlement Footprint Evolution (1985-2015) dataset and the Global Impervious Surface Area (GISA) 1972-2019 dataset are also useful to assess the changes in land use and land cover in Nairobi county. These datasets are drawn from the World Settlement Footprint suite, which consists of several different products which are instrumental in studying urbanization. The measures of impervious surface area include manmade surfaces such as buildings, roads and rails which cause both hydrological and ecological effects.
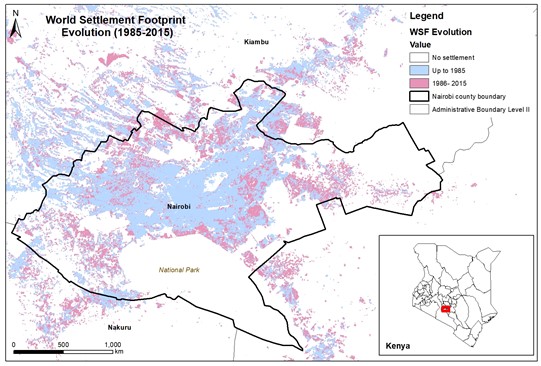
Figure 3: World Settlement Footprint Evolution: Blue- 1985 settlements and Red- settlements established 1986-2015; Image created by Selamawit Tesfay in ArcGIS 10.8 using data from Marconcini et al. (2020)
From the above images (Figure 1-3 ) it is clear that as the spatial extent of the urban settlement is expanding and there is a loss of grassland areas. Figure 4 shows the same trend by depicting the drastic increase in impervious surface area from 1972 to 2019. Concerted efforts are required by the government and all stakeholders to adopt measures that protect all registered forests areas and ensure environmentally sensitive urban planning.
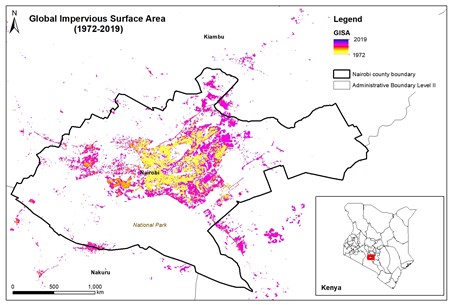
Figure 4: Global Impervious Surface area (1972-2019); Image created by Selamawit Tesfay in ArcGIS 10.8 using data from Huang et al. (2021)
As the world moves to address Climate Change and its effects, the County of Nairobi should institute a raft of measures to protect its residents and the remaining vegetation, particularly wooded areas. In partnership with development partners and research institutions, the county could obtain time series data on the city’s tree and land cover in order to understand and quantify the loss of vegetation cover and its linkages with population dynamics and health in the city. This work could inform future planning and greening interventions, going a long way in the formulation and implementation of policies that maintain the delicate balance between development and the natural world, benefiting future generations of Nairobians.
*We thank Selamawit Tesfay from New Light Technologies for her help in image analysis.