For evaluators, some of the most pressing challenges are also the most difficult to address with traditional data collection methods. How do you gather reliable data in places you can’t easily reach? How do you monitor changes across vast regions, track historical trends for ex-post evaluations, or measure something that can’t be captured through a survey? At 3ie, we have used geospatial analysis not only to improve the precision and credibility of evaluations, particularly where conventional methods fall short, but also to ultimately enable and support more informed, evidence-based decision-making across sectors. In this blog, we share examples from our work evaluating food system interventions in arid, wetland, and aquaculture zones.
Overcoming key challenges
Rapid advances in technology have opened doors for evaluators that didn’t exist a decade ago. Geospatial analysis, particularly when paired with remotely sensed data, offers a powerful toolkit. High-resolution satellite imagery, open geospatial datasets, and increasingly accessible analytics tools now allow evaluators to obtain consistent, independent, and sometimes near-real-time data, even in fragile, inaccessible, or resource-constrained settings.
From our experiences at 3ie’s Data Innovations Group, geospatial analysis is particularly valuable in:
- Collecting data in fragile or inaccessible contexts
- Covering a vast expanse or region
- Gathering frequent or historical data for ex-post evaluation
- Explaining unexpected evaluation findings
- Confirming theories or mechanisms
- Verifying survey data with an independent data source
- Measuring variables that cannot be (easily) captured in surveys or administrative data
- Constructing control groups for quasi-experimental designs
- Working within resource constraints
Four real-world cases for geospatial impact evaluation
1.Uncovering the impact of an irrigation scheme in Niger
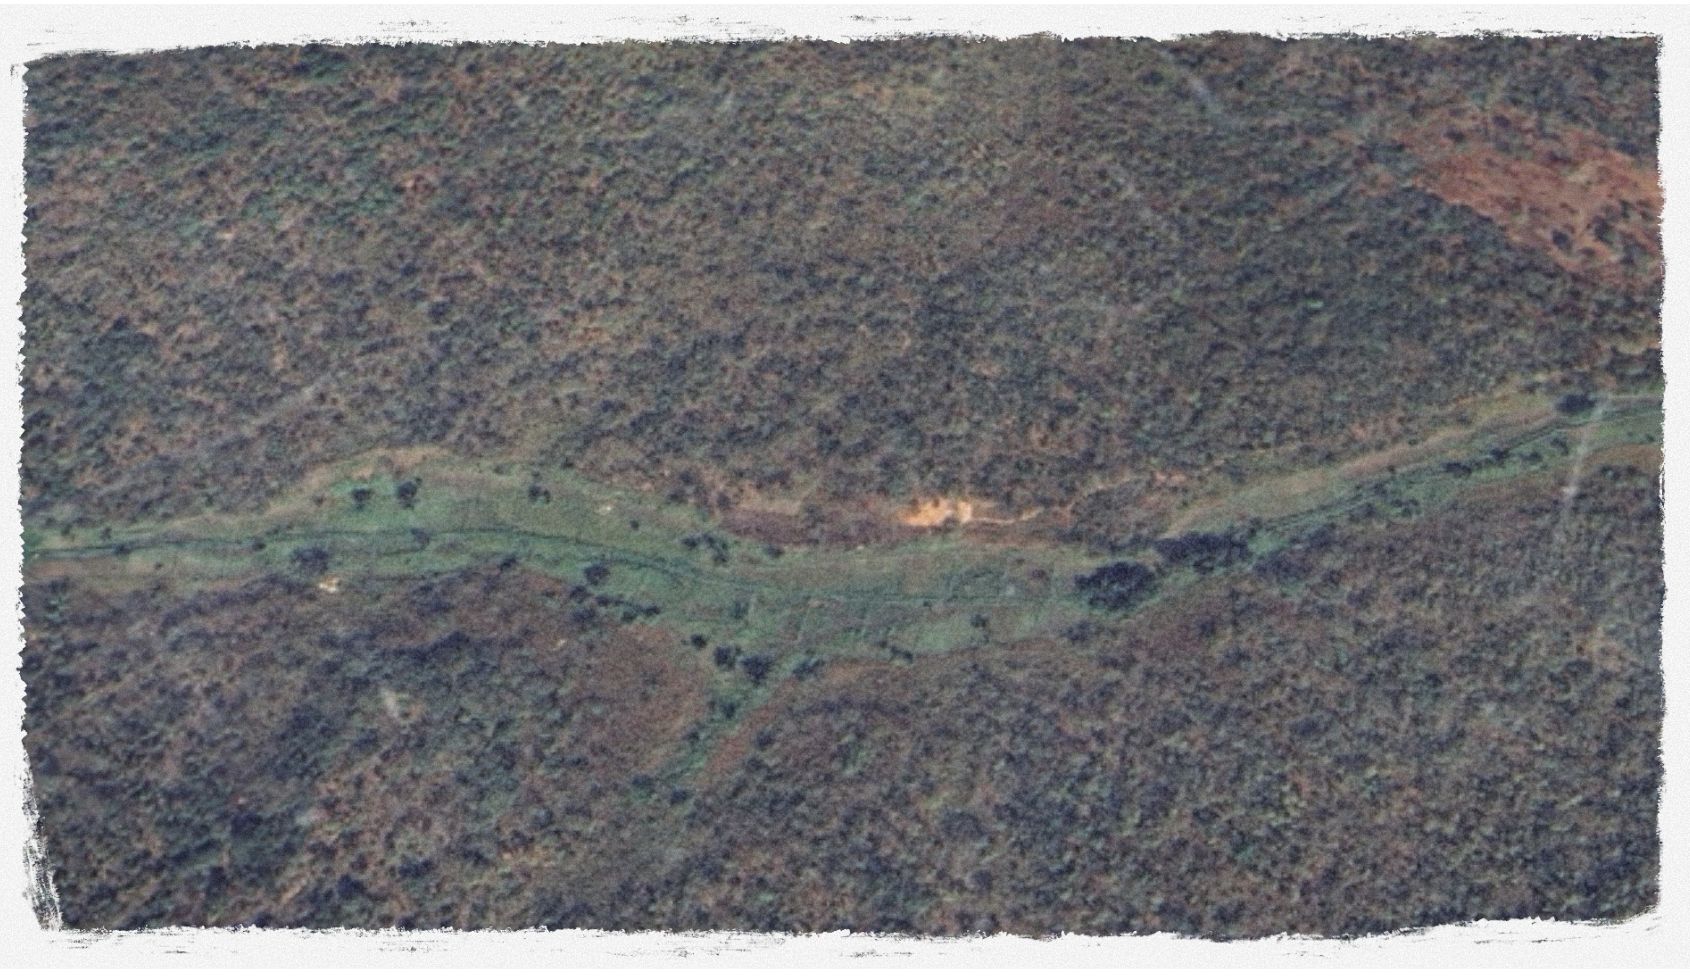
3ie evaluated the impact of an agricultural intensification program on food production in remote, drought-prone regions of Niger. But returning to collect outcome data wasn’t an option: the intervention areas were hard to reach, security risks were high due to conflict, and the cost of a rigorous ex-post survey was prohibitive. Instead, we took advantage of the granular and frequent nature of geospatial data to measure changes via remote sensing proxy indicators—NDVI, SAVI, soil moisture—alongside precipitation and temperature covariates. In the early stages, we debated several vegetation indices in addition to NDVI, but SAVI stood out for its performance in dry, sparsely vegetated areas. 3ie’s Remote Sensing Inventory helped us quickly compare and confirm this choice.
The frequent, granular and expansive nature of the geospatial data also allowed us to build a robust counterfactual. Using a novel synthetic difference-in-differences (SDID) approach—a data-driven method to select valid, comparable plots of land based on pre-trends in the outcomes—we were able to isolate the impact of the intervention.
2.Evaluating supply-side interventions for marshland agriculture in Sierra Leone and Guinea
In Sierra Leone and Guinea, 3ie evaluated inland valley swamp (IVS) interventions, including farmer training, conditional cash transfers, and fencing, to reduce farmer-herder conflict and improve livelihoods. To assess the effectiveness of the program, we relied heavily on geospatial data, particularly Sentinel-2 imagery to track vegetation health using NDVI, alongside interviews and site visits.
Throughout the evaluation, we faced several challenges common in impact evaluations, such as collecting data in fragile and inaccessible contexts, covering large areas, and creating a reliable control group. Satellite imagery reduced the need for extensive on-the-ground surveys due to its frequent and vast reach, while machine learning techniques helped us identify and refine control sites, ensuring comparability without the need for manual fieldwork in remote areas. This allowed us to independently verify survey data, track vegetation changes over time, and construct a robust control group.
3.Tracking aquaculture expansion in Bangladesh
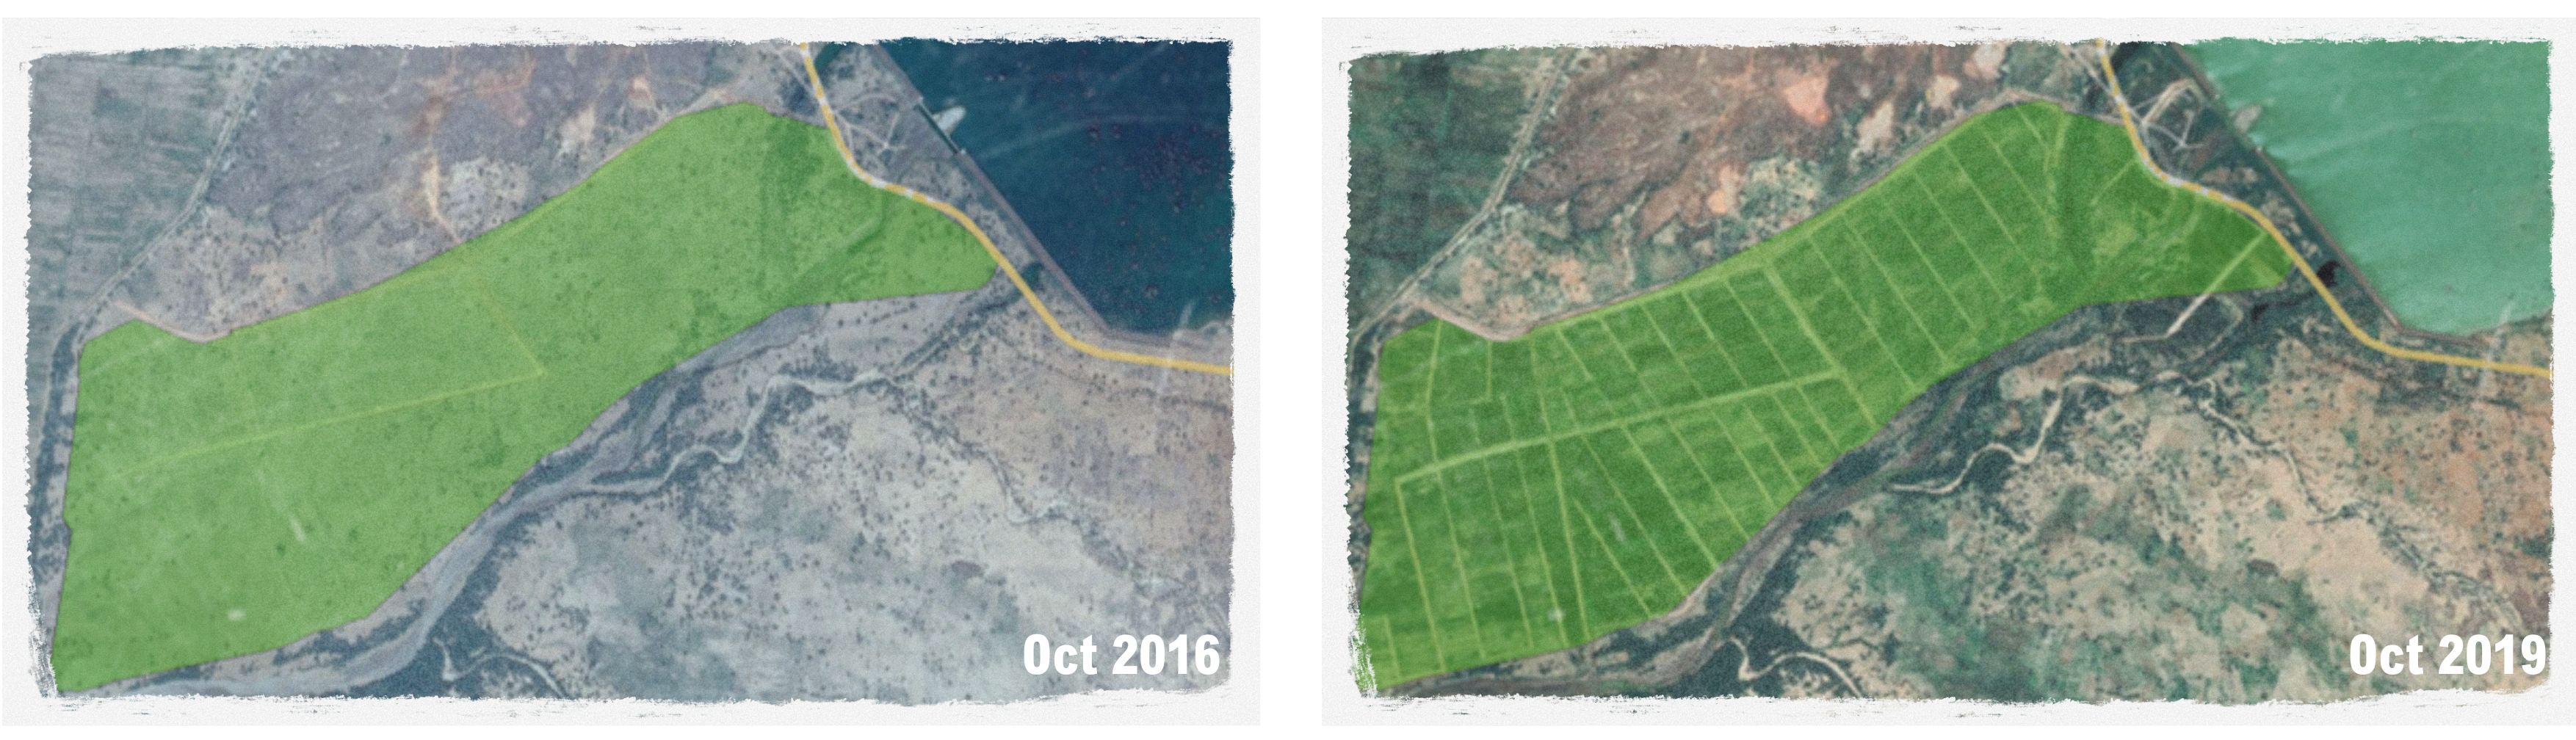
In Bangladesh, 3ie assessed an aquaculture intervention designed to boost productivity, nutrition, and women’s empowerment through farmer training, access to quality fingerlings and feed, and stronger market linkages. Surveys and field observations suggested that aquaculture was expanding, but verifying this post-project was difficult. Without the option to return to the field, we turned to geospatial analysis to confirm our findings.
We processed multi-year satellite imagery to detect waterbodies using NDWI, MNDWI, and AWEI indices, then classified aquaculture ponds using a logistic regression model trained by Yu et al. (2020). This confirmed the growth trend across both treatment and control areas, allowing us to compare patterns between the randomized control treatment arms. Here, remote sensing not only allowed us to cover various regions and retrieve historical data, but it also provided an independent check on our findings and enabled us to measure variables such as pond counts and pond surface area—rarely captured in household surveys.
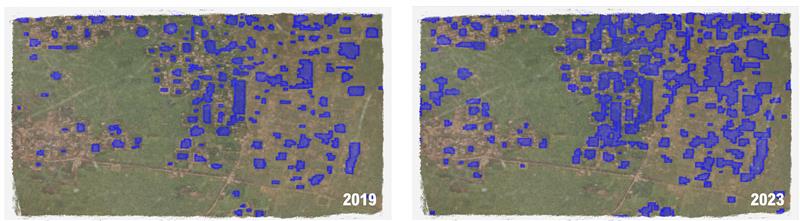
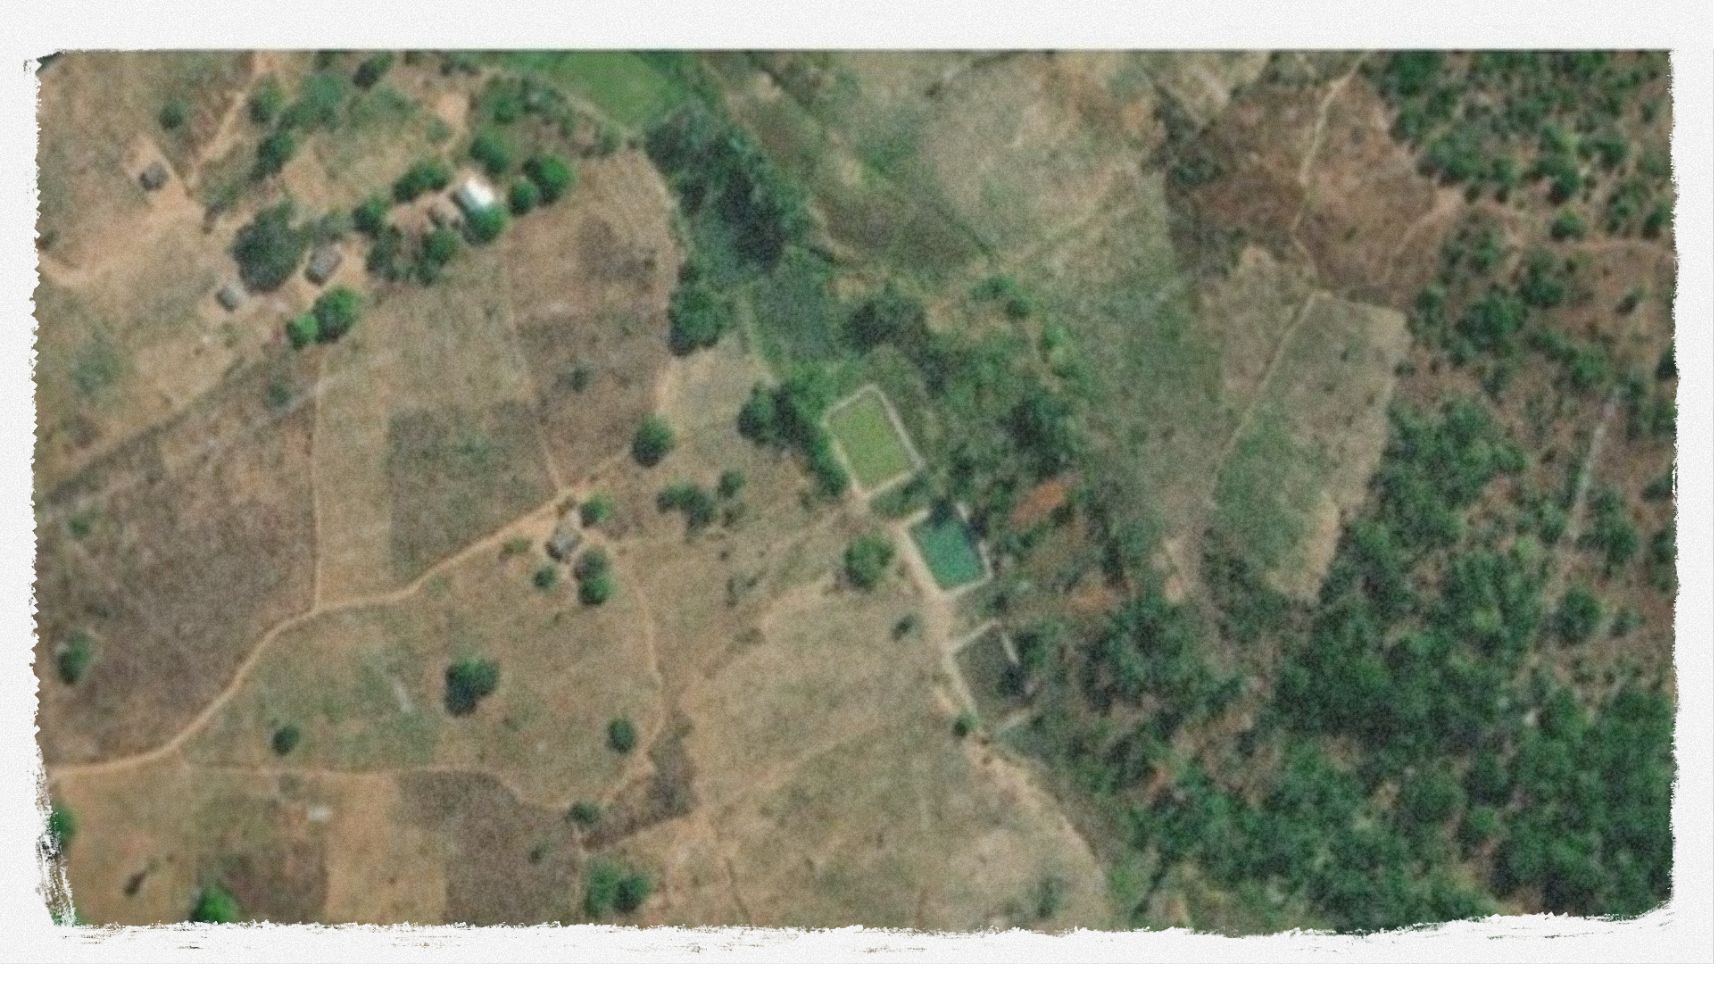
4.Evaluating integrated agriculture-aquaculture systems in Malawi
In Malawi, 3ie is evaluating the impact of integrated fish, crop, and livestock systems and enhanced access to inputs and markets, on food security, income, productivity, and nutrition among smallholder farmers, particularly women. While the main evaluation relies on survey data, we have an opportunity to supplement these findings by assessing pond count, pond surface area, and potentially pond productivity using geospatial indicators. With baseline pond coordinates from ground surveys, we are applying a geospatial application of the Segment Anything Model (samgeo) for object detection in high-resolution imagery that can identify features from text prompts. This will help assess baseline balance in treatment and control villages and allow us to detect and measure changes in aquaculture ponds over time, providing an independent check on survey findings and additional insights into program mechanisms.
These examples illustrate how the right geospatial indicators can help address obstacles like inaccessible sites, limited budgets, and the need for historical data. But choosing the right indicators and applying them well can be daunting. Our Remote Sensing Inventory offers practical guidance on measures such as NDVI, SAVI, and many others, with examples and datasets to support context-appropriate decisions. Here’s our previous blog highlighting what makes this a user-friendly resource.
What’s next?
New methods, like the geospatial foundational models we are piloting in Malawi, make it easier than ever to integrate remote sensing into evaluation practice. At the same time, challenges persist: the cost of high-resolution imagery and computing power, and the technical skills needed for remote sensing and coding. Overcoming these barriers to make the most of these powerful tools will require continued collaboration among evaluators, data scientists, and practitioners.
How can you get involved?
With the right tools, data, and partnerships, we can make geospatial methods a standard part of rigorous, impactful evaluations across sectors and around the world. We’re looking for partners to collaborate on designing and implementing more geospatially enhanced evaluations, and you can help! We invite you to:
- Explore the Remote Sensing Inventory for guidance, resources, and examples.
- Share feedback on indicators, methods, or datasets we should add.
- Reach out (on info [at] 3ieimpact [dot] org) with questions, ideas, or collaboration proposals.
- Support our efforts to maintain and expand this public resource through funding or partnerships.